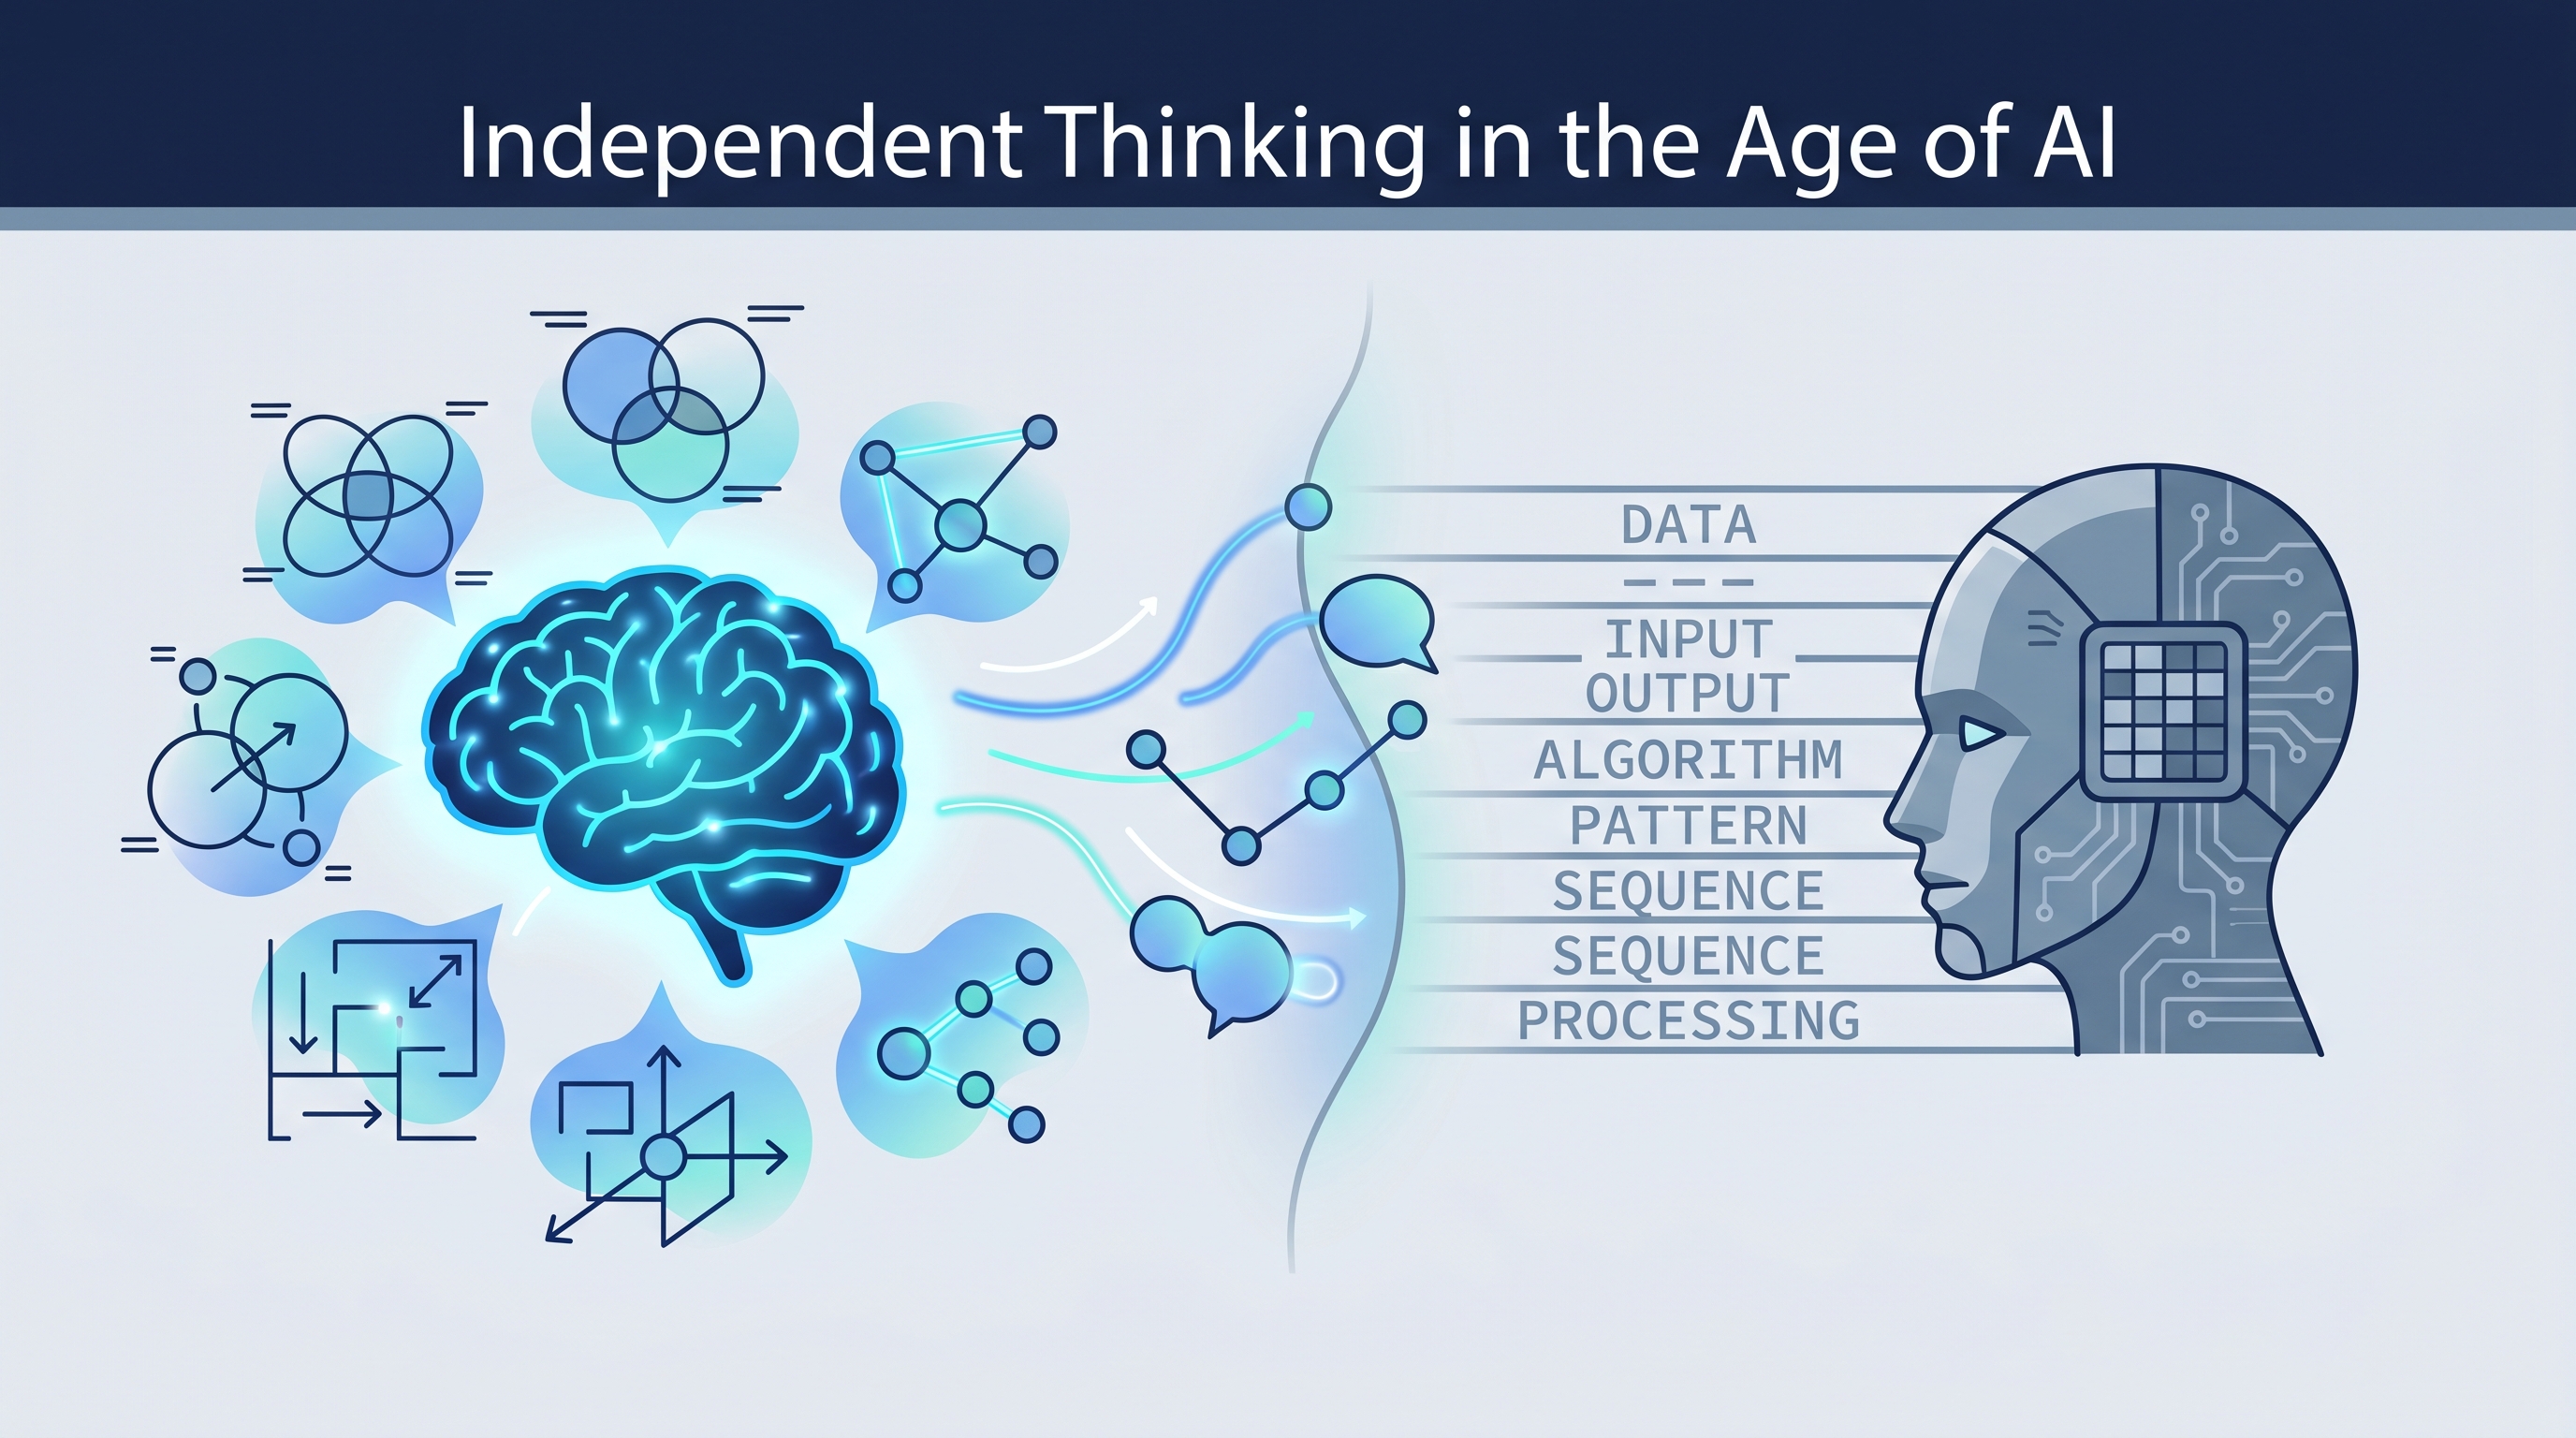
The biggest risk AI poses isn’t job loss — it’s losing our ability to think independently. Zsolt Viczian’s PKM Summit 2026 talk argues that text-based thinking is like “looking through a keyhole,” while our brains evolved for spatial, visual navigation. His solution: 4D Visual PKM, where notes are visual-first with text as metadata, not the other way around. The core insight — different representations of the same problem lead to fundamentally different solutions — has profound implications for how we use AI without surrendering our cognitive agency.
| *Source: Independent Thinking in the Age of AI — PKM Summit 2026 (YouTube) | Zsolt Viczian at PKM Summit | What is Visual PKM | Obsidian Excalidraw Plugin (GitHub)* |
The Core Thesis: AI Is Doing Our Thinking
Viczian opens with a provocation: the PKM community represents the top 0.1-0.5% of deliberate thinkers globally — and even they are at risk.
The GPS analogy: 20 years of GPS has degraded our spatial navigation skills. Most young people can’t read a paper atlas. The same is happening with thinking:
| Technology | What it replaces | Cognitive cost |
|---|---|---|
| GPS | Spatial navigation | Can’t read maps, lost sense of direction |
| Gmail autocomplete | Sentence completion | “Am I completing my thought, or is AI completing it for me?” |
| AI-generated emails | Writing as thinking | You nod “yes, this is great” — but was it your thought? |
“The quality of your life is directly proportional to the quality of thinking you do every day.”
The danger isn’t that AI is wrong — it’s that AI is convenient enough that we stop thinking at all. Steve Jobs warned against “living with the results of other people’s thinking.” Today, add: machines’ thinking.
Why Text Is Failing Us
Text is sequential — you absorb it one word at a time while your mind works hard to stitch pieces together. Viczian demonstrates this with a powerful experiment:
The “odd one out” test:
- Given 100 words in a text list, finding the one that doesn’t belong takes significant scanning time
- Given the same items as images (animals + one box), identification is instantaneous
- AI can solve the text version faster than us — but we solve the visual version faster than AI
Text processing:
  word → word → word → word → ... → mental model (slow, sequential)

Visual processing:
  [entire scene] → instant pattern recognition → understanding (parallel)
Why Our Brains Prefer Visuals
“A mind on the hoof” (Annie Murphy Paul’s term): Our ancestors didn’t survive the savannah by reading bullet points. They navigated spatially, recognized patterns visually, and simulated movement mentally.
- 30%+ of your brain is dedicated to visual processing
- We have mirror neurons that simulate observed movement
- We think in space (“the future is ahead of us, the past is behind us”)
- We remember concrete nouns (ball, book, bottle) easier than abstract ones (freedom, peace, ethics)
- Illustrations turn the abstract into the concrete — that’s why they help us think
The Game of 15: Proof That Representation Matters
This is the most compelling part of the talk. Same game, two representations:
Version 1 (text/numbers): Players take turns picking numbers 1-9. First to collect three numbers summing to 15 wins.
Try it — your mind literally burns juggling combinations. Even educated adults struggle.
Version 2 (visual/spatial): Same game, but laid out as a 3×3 magic square (every row, column, diagonal sums to 15). Players mark circles and crosses.
Magic Square:
┌───┬───┬───┐
│ 2 │ 7 │ 6 │
├───┼───┼───┤
│ 9 │ 5 │ 1 │
├───┼───┼───┤
│ 4 │ 3 │ 8 │
└───┴───┴───┘

Same game → now it's just Tic-Tac-Toe!
A 3-year-old can play what adults struggled with.
“Solving a problem simply means representing it so as to make the solution transparent.” — Saul Amarel
Three principles emerge:
- Different problems benefit from different representations
- The representation drives the solutions you find
- Discovery emerges through iterative experimentation with representations
Outsmarting the Lazy Brain (System 1 vs. System 2)
Daniel Kahneman’s framework, applied to knowledge work:
System 1 (fast, lazy):
  Situation → Immediate judgment (pattern match → done)

  Problem: WYSIATI — "What You See Is All There Is"
  Your System 1 convinces System 2 there's nothing more to look for.

System 2 (slow, deliberate):
  Situation → Explore → Collect data points → Then judge

  Problem: Short-term memory holds only 7±2 items
  Solution: Write it down — but text is a "cassette tape" (sequential)
  Better solution: Diagrams = "visual prosthetics for better thinking"
Edward de Bono’s recommendation: inject exploration between seeing and judging. But exploration requires holding many data points simultaneously — which is exactly what visuals excel at.
The cassette tape vs. iTunes analogy:
- Text = cassette tape (rewind, fast forward, linear scanning)
- Visuals = iTunes (see your entire library at a glance, jump to anything instantly)
The Packing Paradox: Why We Organize Bags Better Than Thoughts
When packing for a trip, you:
- Lay clothes out on the bed
- Lay toiletries on the counter
- Inspect everything visually
- Pack neatly
But when organizing concepts, we immediately switch from “iTunes” (spatial layout) back to “Walkman” (linear text). Why?
Nature vs. nurture:
| Nature (millions of years) | Nurture (school system) | |
|---|---|---|
| Visual | 30%+ brain for visual processing, spatial navigation, pattern recognition | Almost zero training in visual frameworks |
| Text | Not natural — reading/writing is hard, learned skill | Years of essays, books, reading practice |
“The single best way to become a better thinker is by building a library of visual primitives.”
Visual primitives aren’t stick figures — they’re spatial layouts for understanding information: circle maps, double bubble maps, force field diagrams, squid diagrams, concept maps.
Visual Frameworks in Practice: The Circle Map + Double Bubble Map
Viczian demonstrates with the dilemma: “Should I quit my day job to start my own business?”
Circle Map (defining context from different frames of reference)
┌─ Frame: ME (the entrepreneur) ──────────────────────┐
│  ┌─────────────────────────────────────┐             │
│  │  Following my passion               │             │
│  │  Creative control & freedom          │             │
│  │  Being my own boss      ┌────────┐  │             │
│  │  Working long hours     │ Quit   │  │             │
│  │  Risky but exciting     │ my job │  │             │
│  │                         └────────┘  │             │
│  └─────────────────────────────────────┘             │
└──────────────────────────────────────────────────────┘

┌─ Frame: MY WIFE (sharing the risk) ─────────────────┐
│  ┌─────────────────────────────────────┐             │
│  │  Proud but terrified                │             │
│  │  Losing weekends & holidays         │             │
│  │  Higher stress at home  ┌────────┐  │             │
│  │  May need to work more  │ Quit   │  │             │
│  │  Unpredictable schedule │ my job │  │             │
│  │                         └────────┘  │             │
│  └─────────────────────────────────────┘             │
└──────────────────────────────────────────────────────┘
Double Bubble Map (comparing perspectives)
        MY VIEW                SHARED              WIFE'S VIEW
    ┌──────────┐          ┌──────────┐          ┌──────────┐
    │ Creative │          │Hard work │          │ Forced   │
    │ freedom  │──────────│  Change  │──────────│lifestyle │
    └──────────┘          │High stress│         │ changes  │
    ┌──────────┐          │Fulfilled │          ┌──────────┐
    │  My own  │──────────│   life   │──────────│ Losing   │
    │   boss   │          └──────────┘          │ freedom  │
    └──────────┘                                └──────────┘
The power: by mapping both frames of reference visually, you empathize with the other party and see where differences actually lie — something linear text makes much harder.
The 4 Dimensions of Visual PKM
Viczian’s evolution model of knowledge management:
| Dimension | What it looks like | Limitation |
|---|---|---|
| 1D | Individual notes, read top-to-bottom | Linear, isolated |
| 2D | Notebooks, folders, diaries | Connected only in your memory |
| 3D | Linked notes (Obsidian, Roam, Notion, Wikipedia) | Still text-first, “wall of text” when you open a note |
| 4D | Visual-first notes with text as metadata | Each note is a spatial canvas; text adds context on the “back” |
In 4D Visual PKM using Obsidian Excalidraw:
- Each note is a visual canvas first (front of the postcard)
- Text is on the back (flip the page for metadata and writing)
- Every visual element can be a link to another note
- You navigate your entire knowledge system through visuals
“It’s not that text first and visuals are illustrations — it’s visual first, and you add text to add additional metadata.”
How LearnAI Team Could Use This
- Course design — use circle maps to define learning objectives from student vs. instructor frames; double bubble maps to compare approaches
- Research synthesis — lay out paper contributions visually instead of linear literature review notes; the Game of 15 lesson applies directly to research: the right representation reveals solutions that text hides
- Student assignments — have students create visual summaries instead of essays; tests comprehension more deeply than text reproduction
- AI literacy — teach students to recognize when AI is “completing their sentences” vs. when they’re doing original thinking
- Meeting notes — replace linear meeting minutes with spatial layouts that show relationships between decisions
Real-World Use Cases
- Decision making — circle map + double bubble map for any multi-stakeholder decision (career changes, project priorities, team conflicts)
- Book notes — Viczian’s “Book on a Page” method: visual summary of an entire book on one canvas, with linked detailed notes
- Presentation design — this entire talk was built in Obsidian Excalidraw with every element linked to source notes
- Teaching complex topics — the Game of 15 → Tic-Tac-Toe transformation is a masterclass in how representation changes understanding
- Personal reflection — WYSIATI awareness: before making decisions, ask “what am I NOT seeing?” and use visual exploration to find it
Tools & Resources
| Resource | Link |
|---|---|
| Obsidian Excalidraw plugin | GitHub |
| Sketch Your Mind (book) | Gumroad |
| Visual Thinking Workshop | visual-thinking-workshop.com |
| PKM Summit 2026 | pkmsummit.com |
| Zsolt’s YouTube channel | Visual PKM |
| Dave Gray’s Gamestorming | Framework source for squid diagrams, etc. |
| Annie Murphy Paul — “The Extended Mind” | Source for “mind on the hoof” concept |
| Daniel Kahneman — “Thinking, Fast and Slow” | System 1 / System 2 framework |
| Edward de Bono | “Inject exploration between seeing and judging” |