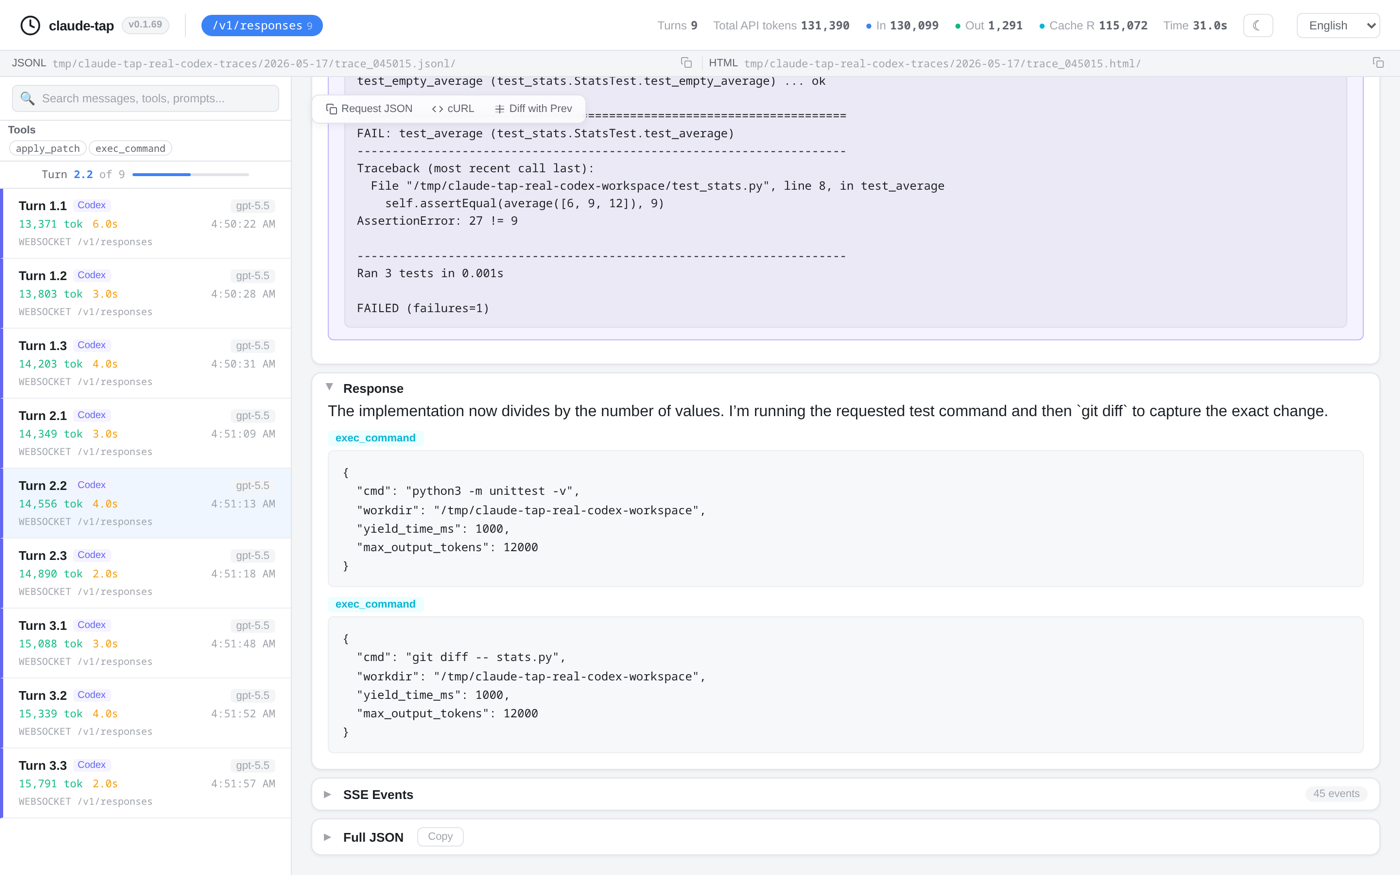
claude-tap is a local proxy and trace viewer for AI coding agents. The durable lesson is bigger than the tool: do not debug agents from vibes; inspect the real request trace. Terminal output shows what the agent chose to say back to you; a trace shows the system prompt, conversation history/messages, tool schemas, tool calls, tool results, streaming response, token usage, and request diffs that produced that behavior.
Sources: GitHub — liaohch3/claude-tap, Local AI Agent Trace Viewer, How to view agent traces locally, PyPI — claude-tap, and GitHub — jianshuo/ccglass.
Why This Belongs in the Wiki
Many agent failures are hard to diagnose if you only read the final answer. The model may have received stale context, the wrong tool schema, a bloated transcript, an unexpected permission mode, or a tool result that quietly changed the task. Without the trace, you are guessing.
The workflow looks like this:
AI coding client
  Claude Code / Codex / Gemini / Cursor / OpenCode / ...
        |
        v
claude-tap local proxy or transcript listener
        |
        v
local trace session
  prompts + messages + tools + responses + token usage
        |
        v
HTML viewer for debugging, review, or archive
That makes it a harness-engineering tool, not just a dashboard. It turns an agent run into an inspectable artifact that can be reviewed by a teammate after redaction, attached to a bug report after review, or compared before and after a prompt/tool change.
What It Shows
| Trace surface | What to check first | Why it matters |
|---|---|---|
| System prompt | Did the agent receive the rules you expected? | Many “reasoning” bugs are really instruction/context bugs. |
| Conversation history | Did stale messages remain in context? | Long sessions can carry irrelevant assumptions forward. |
| Tool schemas | Did the tool definition change between turns? | A small schema change can change which arguments the model emits. |
| Tool calls and results | Did the agent call the right tool with the right parameters? | The answer may be wrong because the observation was wrong. |
| Streaming response | Did partial chunks reconstruct into the final output? | Useful when debugging streaming or tool-call boundaries. |
| Token usage | Did cost grow from history, tool output, or repeated context? | This turns token spikes into evidence instead of anxiety. |
| Request diffs | Which prompt, message, tool, or parameter changed? | Adjacent diffs are often a fast way to localize regressions. |
As of the 2026-07-31 check, the README lists support for Claude Code, Codex CLI, Codex App, Gemini CLI, Grok Build CLI, Kimi CLI, MiMo Code, OpenCode, OpenClaw, Pi, Hermes Agent, Cursor CLI, Qoder CLI, Antigravity CLI, and CodeBuddy CLI. Treat that client list as fast-moving; check the README before teaching installation details.
Quick Start
The PyPI package currently requires Python 3.11+. The README recommends installing with uv, with pip as an alternative:
uv tool install claude-tap

# Or:
pip install claude-tap
Run the client through claude-tap:
# Claude Code, live viewer enabled by default
claude-tap

# Codex CLI
claude-tap --tap-client codex

# Codex App backend request capture
claude-tap --tap-client codexapp

# Gemini CLI
claude-tap --tap-client gemini -- -p "hello"
Export a saved trace when you need a review artifact:
# Regenerate a self-contained HTML viewer from a JSONL trace
claude-tap export .traces/2026-02-28/trace_141557.jsonl -o trace.html

# Export a compact trace bundle, then render it later
claude-tap export <session-id> -o trace.ctap.json
claude-tap export trace.ctap.json -o trace.html
The exported viewer is static HTML. That is useful for teaching, debugging, and incident notes because the artifact can be opened locally without a hosted observability service.
Related Tool: ccglass
The July2 screenshot set surfaced ccglass, which should be treated as a sibling in the same agent-observability family rather than a separate wiki page. Its README describes a lightweight local reverse proxy and web dashboard for seeing what coding agents send to model providers, with support for clients such as Claude Code, Codex, OpenCode, Kimi, Ollama, OpenRouter, and others.
The distinction:
| Tool | Best first use |
|---|---|
claude-tap |
Trace capture/export for Claude Code, Codex, Gemini, and related agent runs |
ccglass |
Quick local proxy/dashboard to inspect model requests across many coding-agent clients |
For students, the shared lesson matters more than which tool wins: agent debugging starts by inspecting the real request and tool trace.
A Student Debugging Drill
Use claude-tap as a lab exercise:
- Run a small task through Claude Code or Codex with a deliberately ambiguous prompt.
- Save the trace.
- Ask students to identify where the mistake entered the run:
- Was the user prompt underspecified?
- Did the system prompt steer the agent away from the intended behavior?
- Did the wrong file or tool result enter context?
- Did a tool schema make the right action hard to express?
- Did token usage grow because the conversation carried too much history?
- Rewrite only the failing layer, rerun, and compare the adjacent request diffs.
The teaching point is first-principles debugging: locate the layer that introduced the error before changing the prompt or blaming the model.
Security and Privacy Caveats
Local does not mean harmless. A trace can include private prompts, file paths, repository names, tool outputs, customer data, or secrets returned by a tool. claude-tap says common auth headers are redacted before recording, but that does not make the whole trace safe to publish. Local trace storage should be protected like repo logs, debug dumps, or terminal transcripts.
Use these rules:
| Rule | Reason |
|---|---|
| Treat traces like private logs | They can reveal code, prompts, tools, and internal workflow. |
| Review before sharing HTML exports | The exported artifact is portable, so accidental leakage is easy. |
| Prefer minimal repro traces | Smaller traces are easier to inspect and safer to share. |
| Do not use local traces as production monitoring | Use hosted observability when you need team dashboards, alerts, retention, and access control. |
| Re-check client support before a class | Agent CLIs change quickly; stale setup instructions confuse students. |
The right mental model: claude-tap is a local microscope for agent runs. It helps you see what happened. It does not replace permission design, secret hygiene, tests, or production telemetry.
How LearnAI Team Could Use This
- Agent observability lesson: teach students that reliable agent work starts from evidence: prompt, context, tool schema, tool call, tool result, and token usage.
- Debugging practicum: give students two traces from adjacent runs and ask them to identify the exact request difference that changed behavior.
- Review artifact: attach an exported HTML trace to a hard bug report or cross-model review when the question is “what did the agent actually see?”
- Token-cost workshop: pair this with Token Guard and context-management lessons so students can connect context growth to real usage.
- Tool-design critique: compare traces before and after changing a tool schema to show how API design shapes model behavior.
Attribution
The cover image is adapted from docs/viewer-light.png in the MIT-licensed liaohch3/claude-tap repository.